
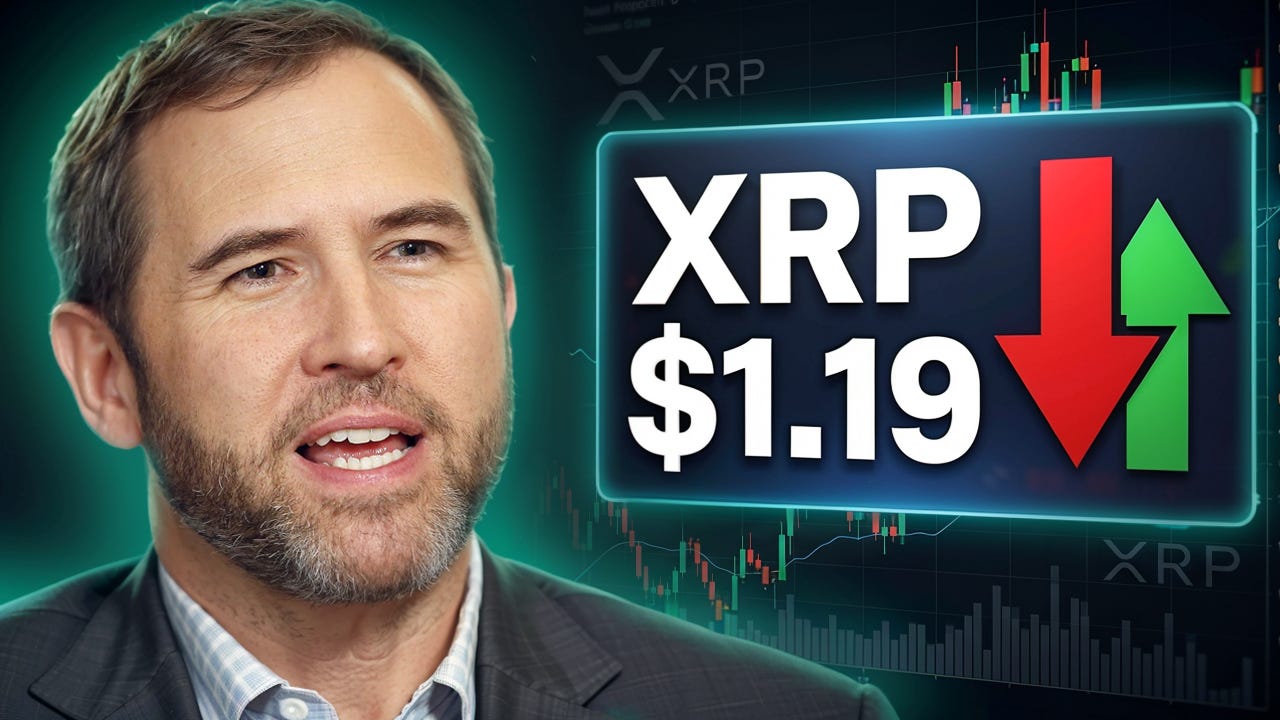
XRP price drops to $1.19: are we headed for a freefall or is it a minor retest?
XRP price drops to $1.19, retesting a crucial support after a failed breakout and raising the fear of further losses.
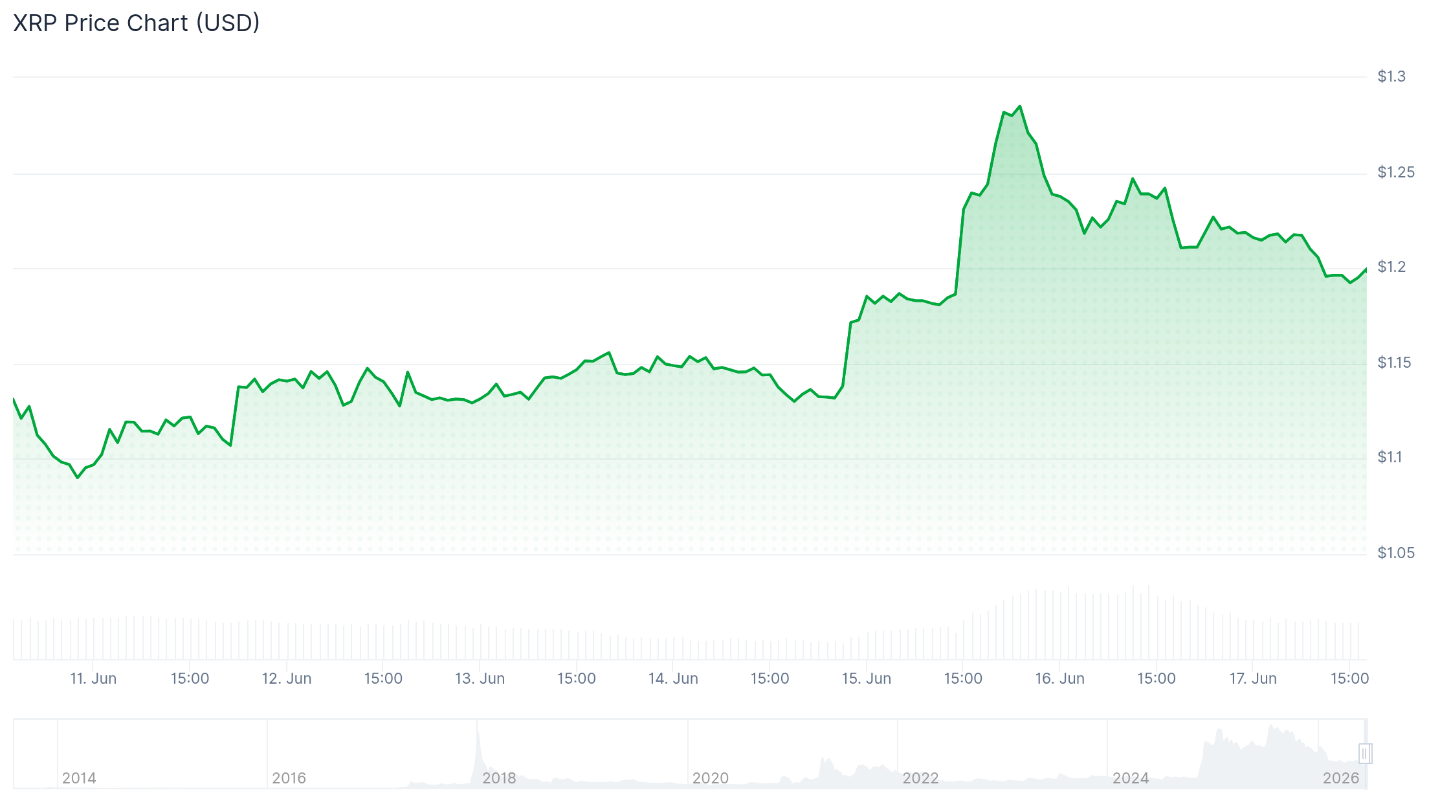
The XRP price slipped back to a low of $1.19 earlier today, putting one of the market’s most closely watched support zones back in focus.
After spending part of the month trading above $1.25, XRP has lost momentum and is now testing an area that many traders have identified as a key line between stability and further downside.
Although XRP had bounced back to trade at around $1.20 at the time of writing, it still remains 2.5% down over the past 24 hours, though it remains up 8.5% over the last seven days.
Failed breakout puts pressure on XRP
Notably, the XRP price decline comes after the token briefly pushed above $1.26 before sellers regained control of the market. XRP had reached approximately $1.29 on June 15 before retreating to around $1.2205 within a 24-hour period.
Trading activity increased significantly during the selloff, and the heavy selling pressure pushed XRP below the $1.2240 support level, a level that had previously acted as a short-term floor. When buyers attempted to reclaim lost ground, the recovery stalled near $1.25, turning that area into a fresh resistance zone.
This shift in market structure shows that bullish momentum weakened as XRP approached higher levels. Instead of building on the breakout, the cryptocurrency surrendered its gains and returned to an area that traders had already been monitoring closely.
The $1.19 level now carries additional significance because it sits within the broader support range between $1.17 and $1.24 that has repeatedly attracted market attention in recent weeks.
Whale accumulation continues in the background
While price action has turned cautious, on-chain data presents a different picture.
According to Santiment data, large XRP holders have accumulated approximately 1.53 billion XRP over the last six months. Wallets holding at least one million XRP now control about 74.1% of the available supply, highlighting continued accumulation among major market participants.
While such activity does not guarantee higher prices in the short term, it does show that some of the largest holders have continued adding to their positions despite XRP remaining well below its previous highs.
The accumulation trend becomes more notable when viewed alongside XRP’s current price. The token is still trading roughly 67% below its all-time high of $3.65 recorded in July 2025. Even after several recovery attempts this year, XRP has struggled to establish a sustained uptrend.
For traders, the contrast between ongoing whale accumulation and recent selling pressure creates one of the most important themes currently shaping the XRP market.
Macro conditions remain a major factor
Beyond technical levels and on-chain activity, broader economic conditions continue to influence crypto markets.
Eyes are on the Federal Reserve policy developments following the arrival of Kevin Warsh as Fed Chair. Market participants have become increasingly sensitive to interest-rate expectations, inflation trends, and liquidity conditions.
These factors matter because risk assets, including cryptocurrencies like XRP, often respond to changes in monetary policy. A tighter liquidity environment can limit speculative demand, while improving financial conditions tend to support higher-risk investments.
Key XRP price levels to watch next
The latest XRP news shows a market caught between competing forces. Whale accumulation remains active, Ripple continues expanding the XRP Ledger’s capabilities, and institutional interest has not disappeared. At the same time, recent selling pressure has erased breakout gains and returned XRP to a critical support zone.
For now, the most important level remains the support at $1.19 and the 7-day Simple Moving Average (SMA) at $1.1798.
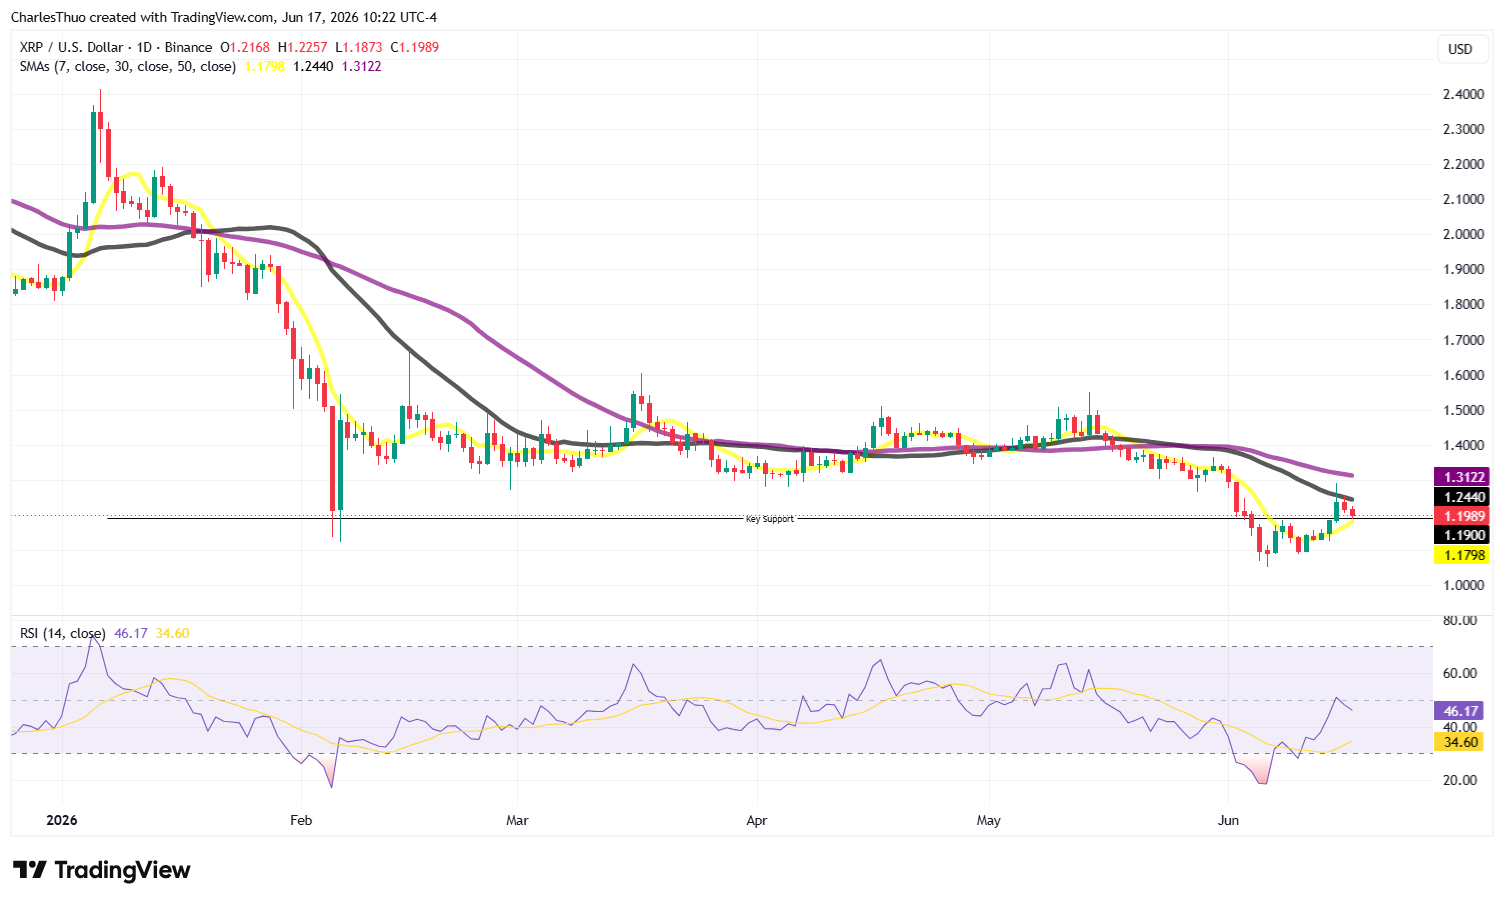
A successful breakout above the 7-day SMA would reinforce the view that the recent decline is a retest following a failed breakout attempt. On the upside, traders should watch the resistance around the 30-day SMA around $1.2440, an area that has repeatedly limited bullish advances.