
Breaking: XRP Just Flashed 4 Major Signals Investors Can't Ignore
XRP is at a crossroads. Explore the key technical, on-chain, and institutional signals every trader should watch next.

XRP has spent another week under pressure, falling to around $1.05 after losing nearly 9% over the past seven days.
On the surface, the trend still belongs to the bears.
But beneath the price action, several developments suggest the market may be approaching an important decision point.
This week’s data paints a mixed picture. Technical indicators remain weak, institutional flows are telling a different story, whales appear to be accumulating, and Ripple continues improving the XRP Ledger.
The question traders should be asking isn’t whether XRP is bullish or bearish; it’s which narrative will win first.
The Technical Picture
The chart still favours sellers, with 61% of technical indicators being bearish.
In particular, all major daily moving averages signal a downtrend.
XRP continues trading below its 10, 20, 50, 100, and 200-day EMAs.
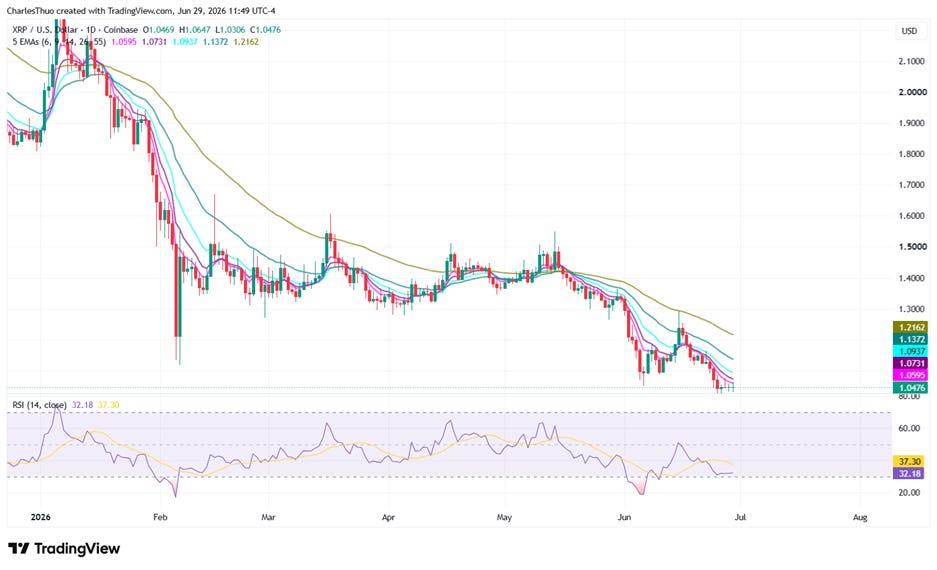
However, the weekly RSI has fallen to 32.18, just above the oversold region.
An oversold RSI reading often signals that selling pressure may be becoming exhausted, although confirmation is still needed.
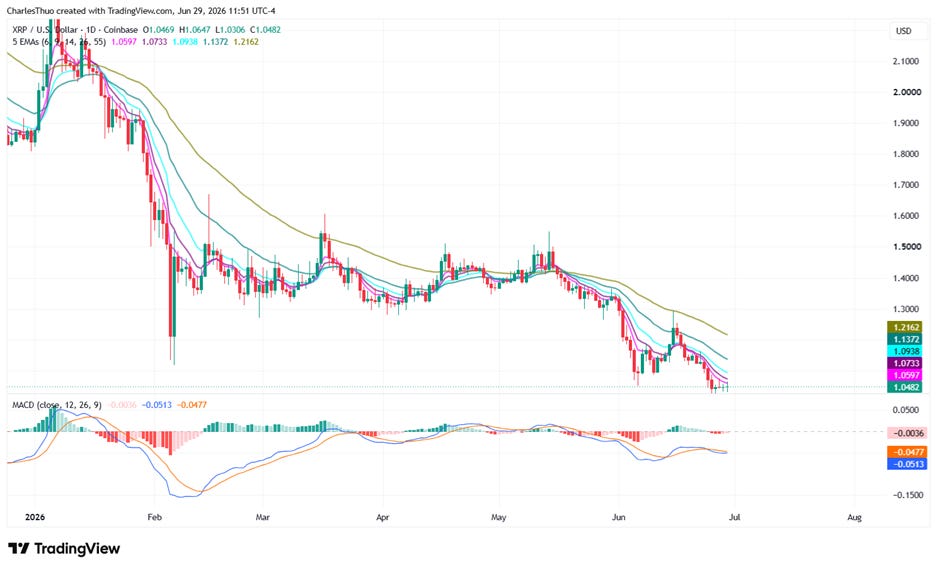
Also, while the MACD is still on the negative side, the MACD is closing in on the signal line, and the histogram is also rising towards zero, all signs of a possible price reversal.
The technicals are important, but they don’t tell the whole story.
Beyond the charts, four powerful signals are shaping XRP's next move, and
Subscribe to continue reading this newsletter
Upgrade now and get 50% off